Power BI Flight Booking Performance Dashboard
Background:
The project involves analyzing sales and flight data for a fictitious airline company during Easter in 2019 and 2023 to compare performance before and after the COVID-19 pandemic. The goal is to identify trends and differences to generate actionable insights for the Revenue and Net Planning departments.
This report answers the following business requests:
- Create Power BI dashboard to effectively analyze and visualize the provided dataset?
- What key performance indicators (KPIs) can be derived from the dataset to measure sales and flight performance?
- What trends, outliers, or developments can be identified in the data, and what actionable insights can be drawn for stakeholders?
- Three cvs files: sale, booking and flight info and detailed description
I took the following actions to create the report:
Tools: Power BI Desktop & Python
- Data exploration to have overview of the dataset is done in python
- Data cleaning steps such as fill/drop null values, data validation etc
Data extraction, transformation and load in Poer BI for modeling and visualization.
Power BI Model:
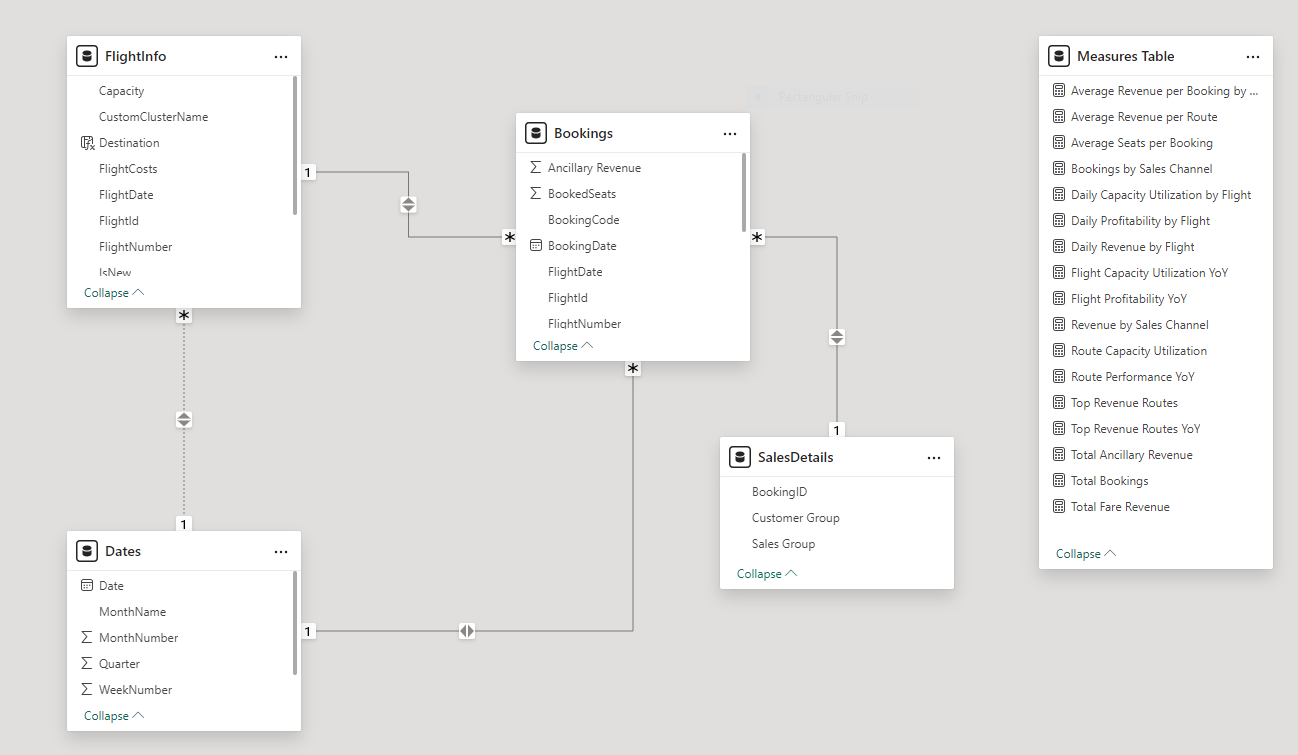
- 3 tables were modeled from the primary data source using Power Query
- One calender table and a table for all DAX calculated measures.
Power BI Dashboard:
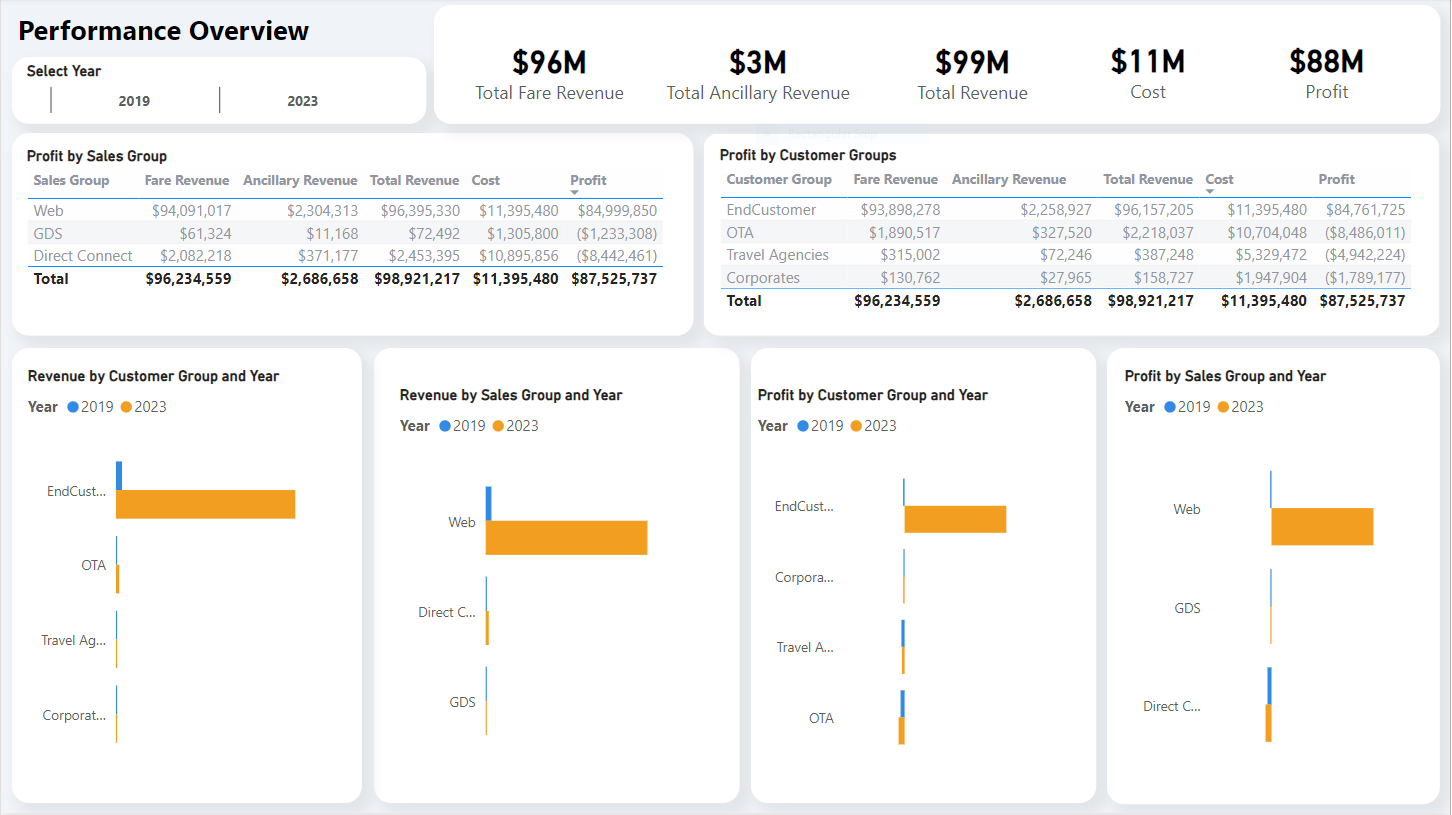
Performance Overview:
Key Insights:
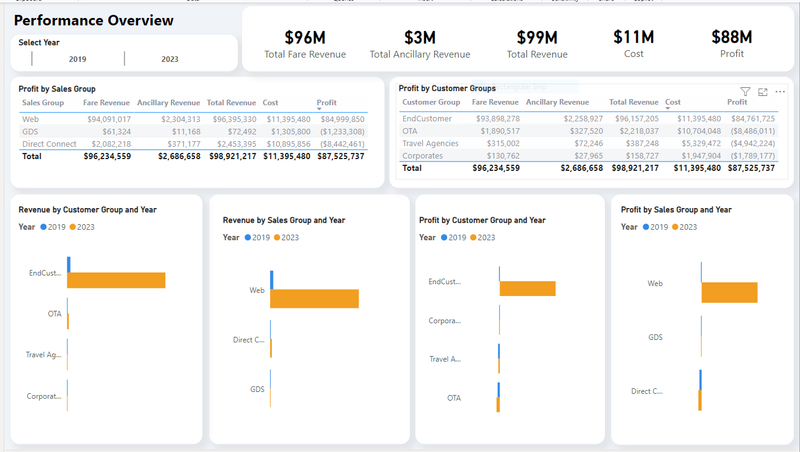
- Exponential Growth in Revenue: Revenue experienced exponential growth, with an approximate increase of 98% from 2019 to 2023.
- Year-over-Year (YoY) Flight Bookings: Year-over-year (YoY) flight bookings increased by over 90% between 2019 and 2023.
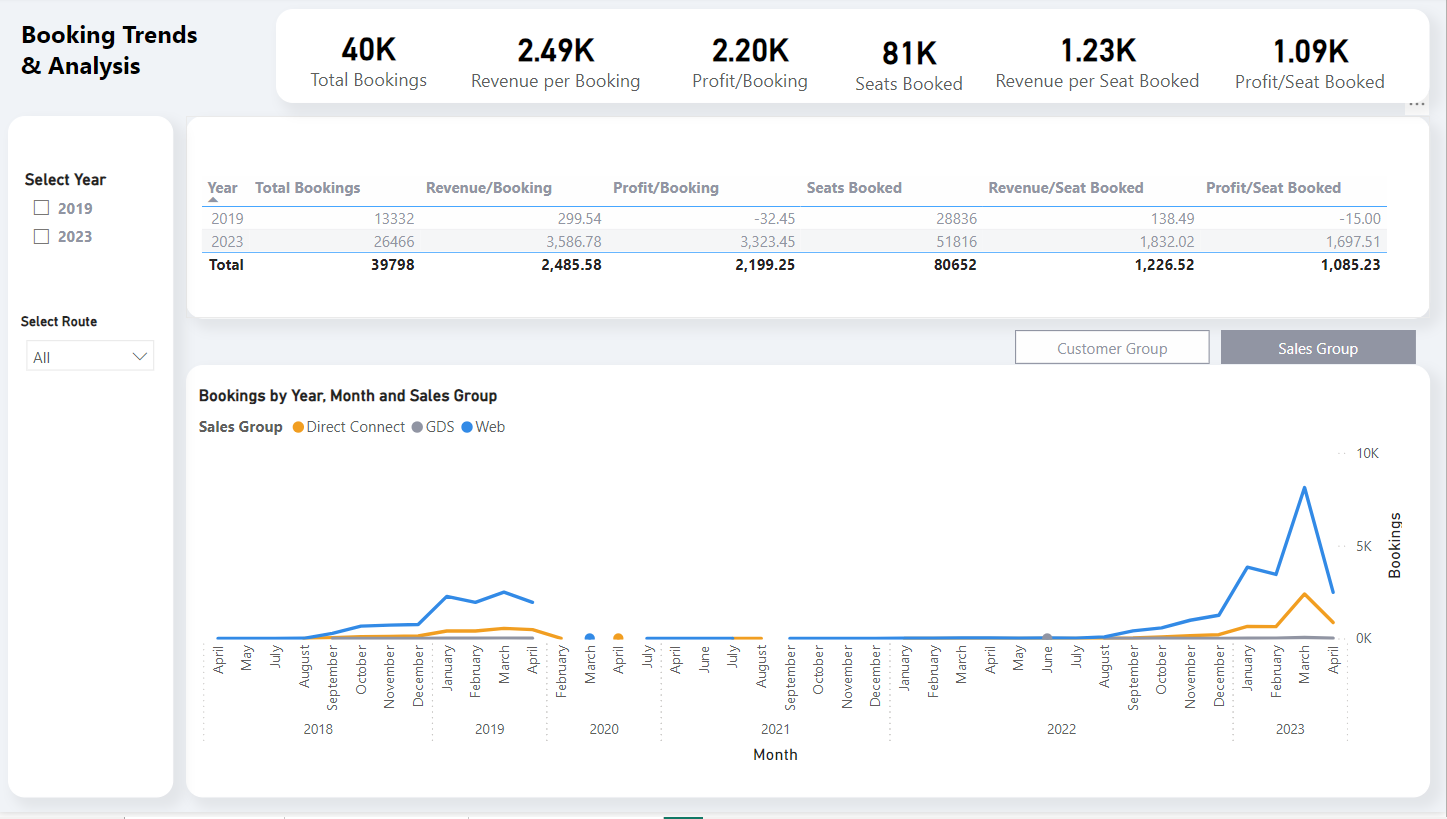
Booking Trends & Analysis:
Key Insight:
- For the Customer Group and Sales Group: In both the Customer Group and Sales Group, 80% of total bookings are generated by end customers and web channels, respectively.
Route (Origin & Destination) Analysis:
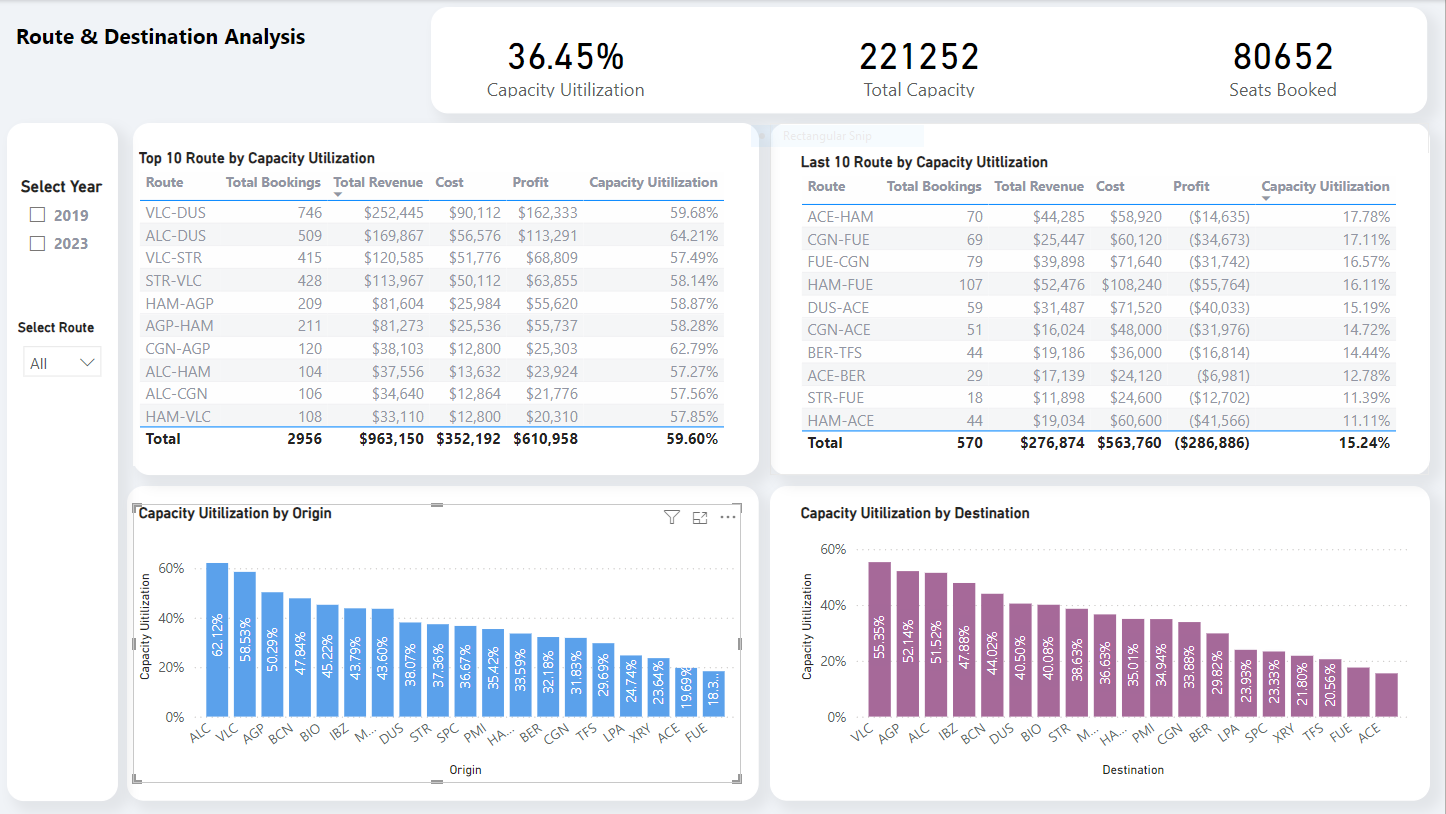
Key Insights:
- Capacity Utilization: The overall capacity utilization is 36%, which seems to be on the lower side. When comparing the capacity utilization of 30% in 2019 to 40% in 2023, it becomes evident that flight capacity was underutilized in each year under review.
- Non-Performing Routes: Out of over 1,200 total routes, only 20 of them have achieved over 50% flight capacity utilization. This means that just 2% of the total routes performed above the average capacity.
RECOMMENDATIONS
- A Sustained Growth Approach: It is advisable to maintain sustained growth in all key metrics, such as revenue, profit, and bookings, during the post-COVID-19 period. To achieve this, strategies implemented by various stakeholders and departments should align with these objectives.
- Underperforming customer groups: Steps should be taken to address underperforming customer groups (Corporate, OTA, and Travel Agencies) and sales groups (Direct Connect and GDS). For instance, targeted marketing strategies should be developed to increase bookings from these groups. In fact, the top priority should be to increase overall bookings.
- Low Capacity Utilization: As observed, the current capacity utilization is suboptimal. Operating at less than 50% capacity is highly inadequate, and it is strongly recommended to take immediate measures to rectify this situation.
- Nonperforming Routes: There is a need to evaluate nonperforming routes to determine their viability. It is advisable to discontinue unprofitable such as ACE-STR, ACE-HAM, ACE-DUS, and the like and reallocate resources to more lucrative ones.
- A Root Cause Analysis is recommended: Overall, the sales and flight performance do not appear to be impressive. While there might be a significant percentage increase between 2019 and 2023, the absolute figures for total bookings, total revenue, profits, and capacity utilization rate are relatively low. Hence, further investigation into pricing strategies, effective campaigns, customer experience, feedback, competitor analysis, and many other plausible factors is warranted.
Conclusion:
The project provide a comprehensive analysis, visualization and insights and key recommendation to optimize revenues, effective planning of route and increase capacity utilization of flight operations.
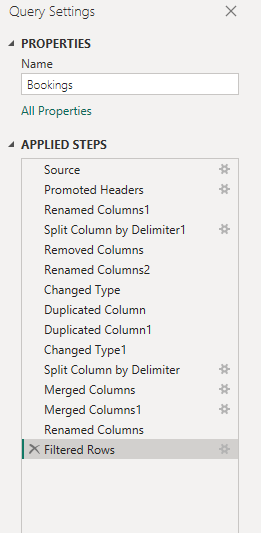
Here is further data transformation steps in Power Query:
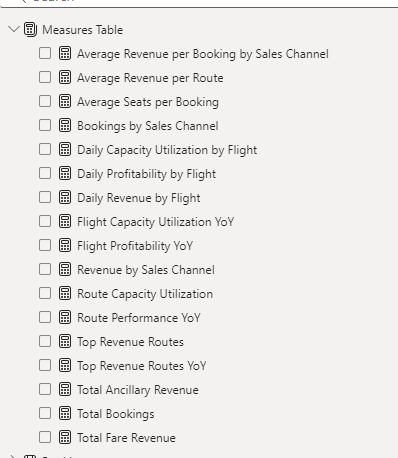
Here is how the DAX measures appear n the measure selection pane:
Project Repo:
- Some Operational questions are anwered here
- Power BI file
- Python file
- CSV files
Thank you!
I appreciate your time for visiting my porfolio.
If you'd like to chat about me joining your team, feel free to reach out on LinkedIn
